Open-Box Price Index, August 2026: Every Category Got Deeper
OpenBoxFox Team
Author
This is the August 2026 edition, archived for reference. See the current Price Index for the latest numbers.
The average open-box discount in the US is now 27% off list price (median 24%), up from 25% in July, across 622,031 live in-stock listings. Every category we track got deeper. This is the second monthly OpenBoxFox Price Index, computed from our entire live database. A new edition comes out in the first week of every month.
Headline numbers, August 2026
- 622,031 in-stock US open-box & refurbished listings with verified pricing
- 27% average discount off list price (median 24%), up from 25%/21% in July
- $27 average dollar savings per listing, up from $23
- Canada has 49,162 in-stock listings averaging 37% off, still well ahead of the US and up another point from July's 36%
- Open-box and used listings (602K items, average price about $49) average 27% off, and certified refurbished (20K items, average price about $424) averages 31% off. As in July, refurbished gets deeper cuts on pricier goods
Average discount by category
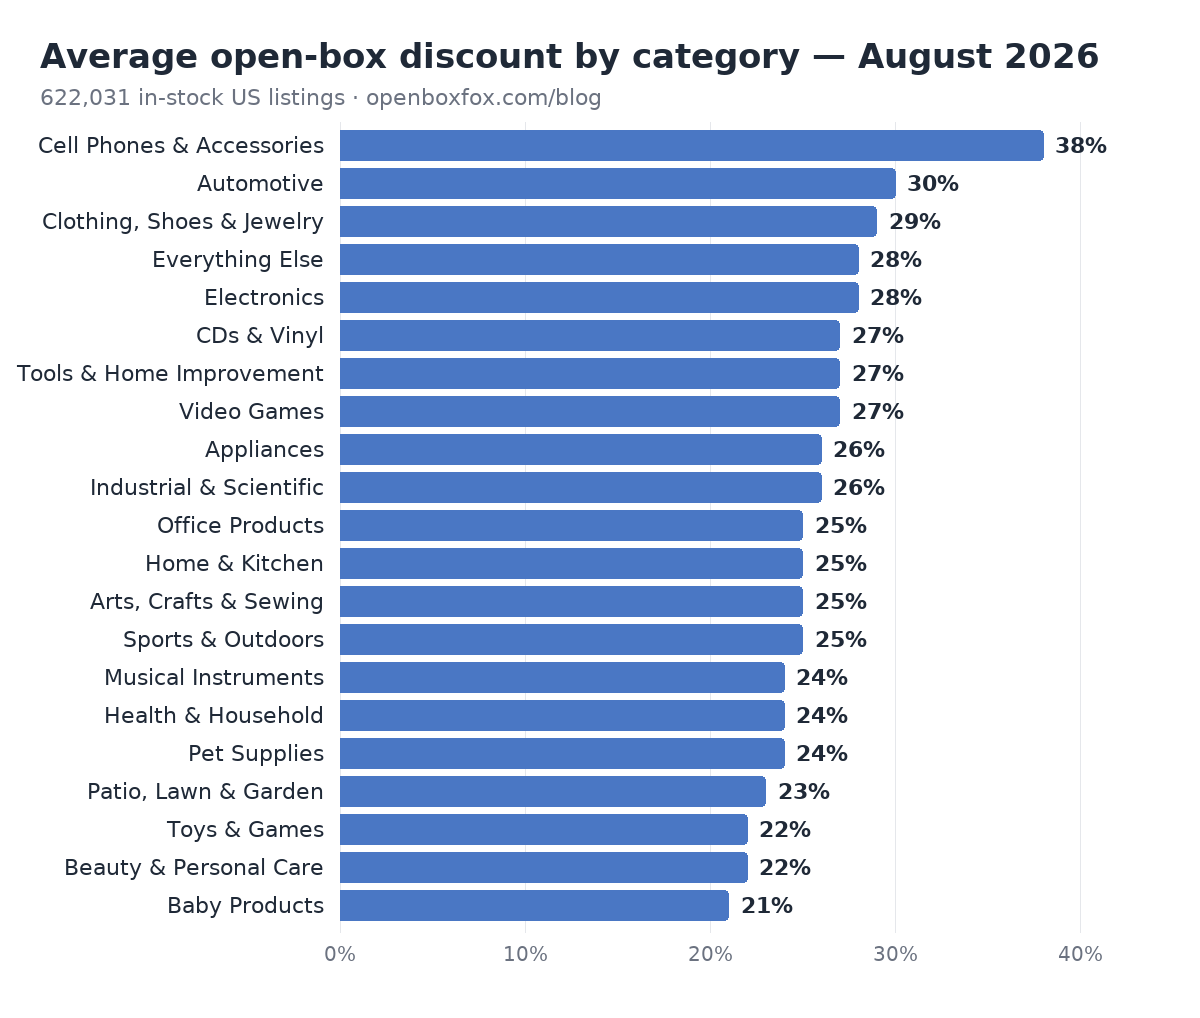
Every top-level category with at least 500 qualifying listings, sorted by average discount:
| Category | Avg discount | Median price | Live listings |
|---|---|---|---|
| Cell Phones & Accessories | 38% | $11 | 33,168 |
| Automotive | 30% | $37 | 71,508 |
| Clothing, Shoes & Jewelry | 29% | $28 | 120,747 |
| Electronics | 28% | $39 | 55,640 |
| CDs & Vinyl | 27% | $32 | 1,308 |
| Tools & Home Improvement | 27% | $34 | 62,720 |
| Video Games | 27% | $36 | 3,941 |
| Appliances | 26% | $31 | 3,065 |
| Industrial & Scientific | 26% | $24 | 11,484 |
| Office Products | 25% | $27 | 10,586 |
| Home & Kitchen | 25% | $25 | 134,016 |
| Arts, Crafts & Sewing | 25% | $15 | 8,404 |
| Sports & Outdoors | 25% | $32 | 30,968 |
| Musical Instruments | 24% | $62 | 3,678 |
| Health & Household | 24% | $21 | 8,534 |
| Pet Supplies | 24% | $24 | 8,137 |
| Patio, Lawn & Garden | 23% | $38 | 27,823 |
| Toys & Games | 22% | $18 | 16,565 |
| Beauty & Personal Care | 22% | $22 | 3,054 |
| Baby Products | 21% | $26 | 3,077 |
Month over month: every category got deeper
This is our first edition with a prior month to compare against. Every category that appears in both July and August rose, and none fell. The increases range from 1 to 3 percentage points. Cell Phones & Accessories, Video Games, Sports & Outdoors, Health & Household, Patio/Lawn/Garden and Arts/Crafts/Sewing tied for the biggest jump at +3 points. Cell Phones & Accessories held the top spot both months (35% in July, 38% in August).
The listing count dropped over the same period, from 847,056 in July to 622,031 in August, almost entirely in the standard open-box and used segment (827K to 602K). Certified refurbished stayed essentially flat (20,103 to 20,466). The drop came from a cleanup between editions that removed sold-out and dead listings, so this month's catalog is smaller but fresher. A discount increase across a cleaner dataset is a more reliable signal than the same increase mixed in with dead stock. We'll see whether the trend holds in September.
What the August data shows
- The July pattern held and deepened. Cell phone accessories still have the biggest percentage discount (38%, up from 35%) at a median price of just $11, mostly cheap cases and cables that get marked down hard. Electronics again have the highest dollar savings per listing ($99 on average), because the items are worth the most.
- Refurbished still combines the two best. It averages 31% off on items averaging about $424, the same discount as July, and remains the segment with the largest savings per purchase in both percentage and dollars.
- Canada's lead over the US narrowed slightly. Both markets got deeper, but the US gained 2 points (25% to 27%) and Canada 1 (36% to 37%), so Canada's edge shrank from 11 points to 10. It's still the better market for open-box shoppers, and Canadian readers should still check the CA catalog first.
Deal of the month
A MacBook Pro 16" (2021, Apple M1 Max, 32GB RAM, 4TB SSD) in certified-refurbished condition for $1,659 against a $4,899 original list, 66% off ($3,240 saved), via Reebelo.com. It was the biggest single dollar saving we found this month. There was one unit, and deals like this typically don't last more than a day or two.
Methodology
The Index is computed from the OpenBoxFox database, our continuous aggregation of open-box and refurbished listings from Amazon US & Canada, Reebelo, Newegg, and other partner retailers. This edition is a snapshot taken August 7, 2026, covering in-stock US listings only (Canada reported separately). We exclude listings with implausible pricing data (discounts above 90% or savings exceeding 9× the sale price) so the averages reflect deals a real shopper would see; a small number of flagged listings with corrupted list prices are also corrected before publication rather than simply hidden. "List price" is the manufacturer's or seller's stated original price; "discount" is the current sale price versus that list. Category assignment follows each listing's primary category. The underlying category table is versioned and reproducible; media inquiries and data questions: contact us.
You're free to cite this report with attribution and a link ("according to the OpenBoxFox Price Index, August 2026"). OpenBoxFox earns affiliate commissions on some outbound links. See our affiliate disclosure.